Understanding oil prices: A tale of two charts

In the first of a regular column on the commodities markets, Jean-François Lambert, CEO of Lambert Commodities reflects on crude oil dynamics

Crude oil dynamics in 2017 are worth reflecting upon. Have a look at chart one. There are two very interesting things:
Chart 1
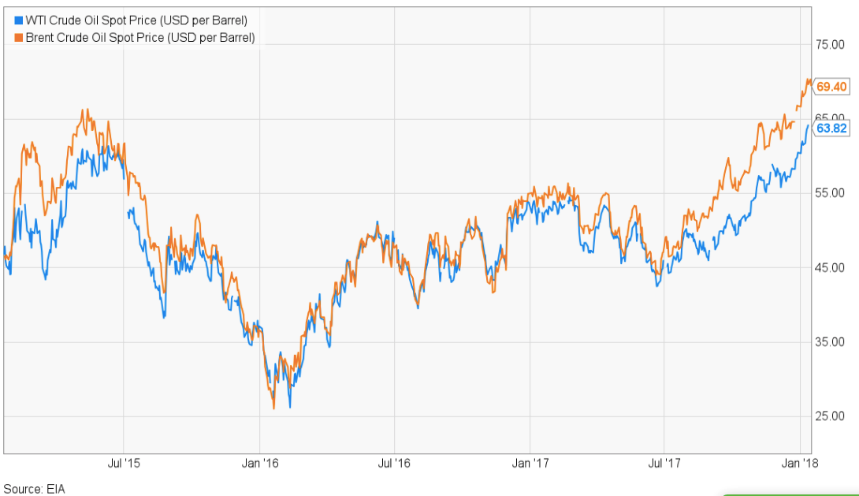
Data cut off January 2018
• First, is obviously the rise in oil prices. After a year or so of fluctuation between $45 and $55 per Barrel (dpb) and within six months, Brent crude oil appreciated by no less than 55%
• Second is the widening gap forming between West Texas Intermediate (WTI) and Brent crude prices during these six months. This is quite an unparalleled situation if looking back on prices since July 2015.
What happened and what does this tell us about the future? Lets’ try to answer the easier question first – there are always smart explanations for past trends.
The rise in the price of oil is a combination of three main factors:
• In November 2016, and under a drive from Saudi Arabia, OPEC together with Russia decided, for the first time in eight years, to cut their production. This was to re-balance the market which had been largely oversupplied until then. For several months this did not work, for two reasons. First was that the market remained largely bearish in the wake of talks about peak demand and anticipation for electric vehicles (EV) to conquer our roads. This stance was reinforced by the shale oil revolution happening in the US and the anticipated fast rise of production of unconventional oil as soon as prices rose, thanks to the cuts.
• However, and this is the second factor underpinning oil prices, as the world economy started to improve across the board (45 countries responsible for 80% of world GDP are in growth mode, according to the OECD). While there was a reality check in EV growth expectations (EV dominance will not happen overnight), markets started to embrace a more bullish stance about demand. Combine this with supply cuts and prices were bound to rise.
• The third reason is found in the US. Shale oil is more nimble than conventional production (turning spigots on and off is much easier for the former than for the latter) and the number of wells kept rising throughout the year. However, production took time to accelerate as shale producers, after almost exclusively focusing on revenues, became mindful of profitability.
What explains the rising gap between WTI and Brent, then?
Again, the answer lies in the US. WTI is more and more the reference price for US production only, whereas Brent is now largely seen as the main reference for crude elsewhere. Shale production breakeven prices are in a 35 and 55dpb bracket, depending on producing areas in the US. This means that as soon as prices were getting close to 55dpb in the first half of 2017, the “shale boys” rushed to hedge their future production, thus locking in some profits or simply an acceptable breakeven. Hedging future sales is a sound strategy, unless prices turn against you… As oil prices started to climb from July onwards, the shale boys’ hedges capped their selling prices at 55 for no less than 70 to 80 pct of their entire 2017 output… This means that as they could not benefit from the 2H2017 rally, the WTI future price got increasingly disconnected from the Brent which was not hampered by massive hedges.
What does this tell us about the future?
Put it differently, is the current rally sustainable? To try to answer the difficult question, let us look at Chart 2.
Chart 2
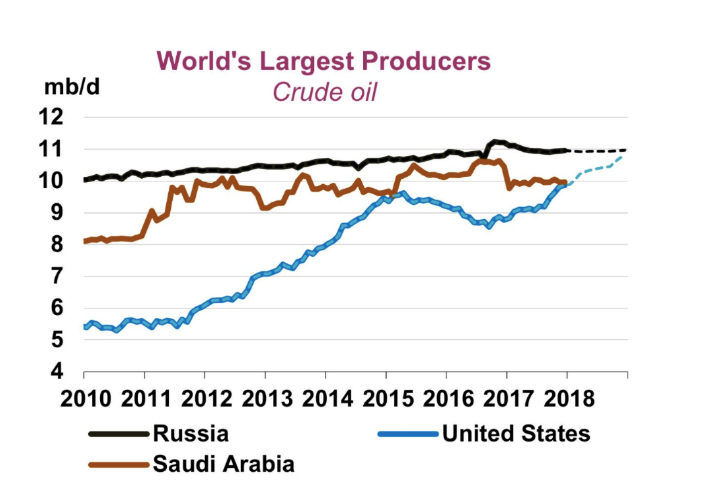
Source: Bloomberg - Data cut off January 2018
What would have been unexpected just a few years ago is that the US is already matching/exceeding Saudi production and will in all likelihood catch up with Russia as soon as the end of this year. It will become the largest oil producer in the world. Unconventional production (shale) is entirely responsible for the output rise in the US and already represents 50% of the country’s output. Furthermore, the ill-timed hedges will soon lapse and, as very little of 2018 output is hedged, one can expect WTI to catch up with the more attractive price levels of Brent, thus fostering the ‘shale boys’’ appetite to turn more spigots on. All this means that unless we witness an unexpected surge in demand beyond the 99.1mbpd forecast by the International Energy Agency for 2018, the surge of US production is likely to be overwhelming and to damp OPEC/NOPEC hopes that their cuts could sustain the current level of prices.
Many factors could interfere with this view, however. ‘'The inevitable never happens. It is the unexpected, always,” to quote John Maynard Keynes: a major geopolitical crisis; an environmental disaster in any of the shale production areas; an unexpected shortage of conventional oil production, this time due to the lack of investment since 2015.
What is unlikely to happen though is OPEC/NOPEC willingness to keep harming themselves and further cutting their output out of despair. Unless unforeseen events occur therefore, we will not see oil price back at 100dpb anytime soon.
One last word of caution though: predictions tend to be proved wrong as soon as they are made, so a contrarian view to the above may be wise.